Introduction
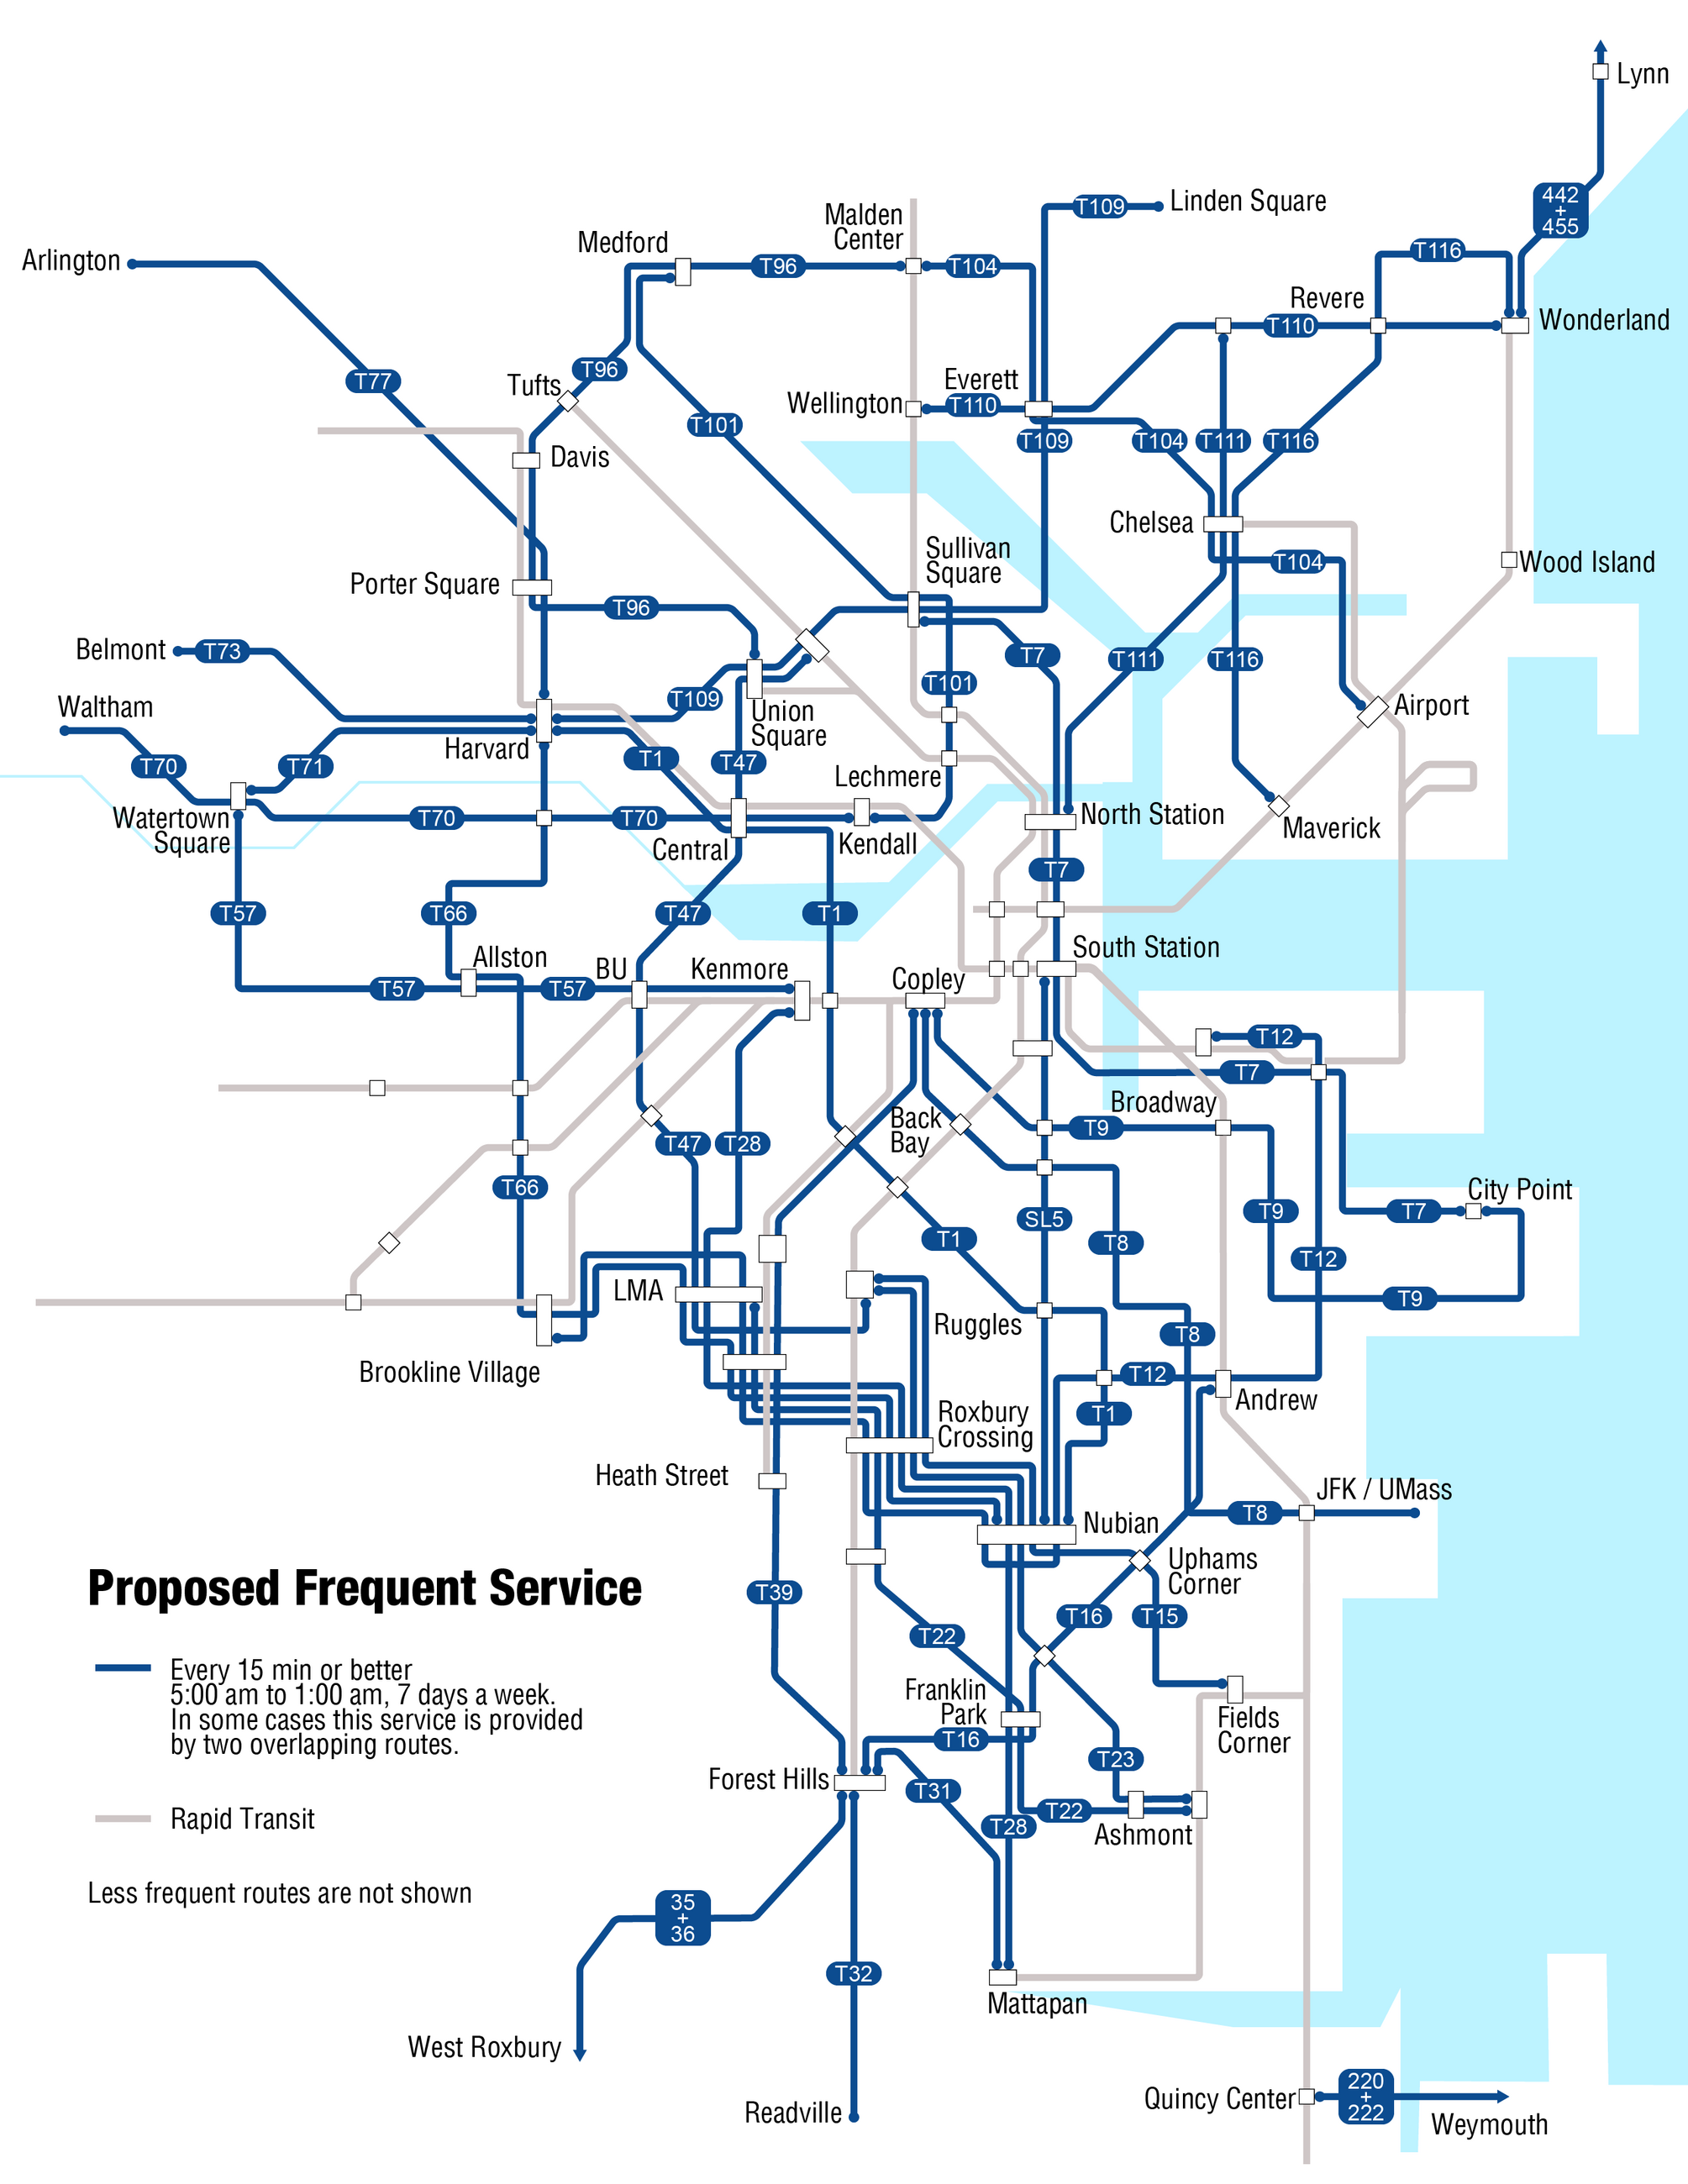
The MBTA is introducing frequent bus routes as part of its Bus Network Redesign project. Between 2024 and 2029, it aims to increase service frequency on eighteen key routes to every 15 minutes or less between 5:00am and 1:00am, 7 days per week. As of August 24, 2025, the 1, 15, 22, 23, 28, 31, 104, 109, 110 and 116 buses have been designated as frequent routes.
The map of the eighteen frequent routes is below:
 Source: MBTA
Purpose
Reliable, frequent service is critical for the success of a public transit system. People need to feel confident that buses will arrive and depart on time, when they need them, so they can plan around them. Without this confidence, people will use other transportation modes if they have the choice, or lose time and miss opportunities if they don't.
The frequent bus routes are an important step in the right direction. A person arriving at a bus stop at a random time can expect an average wait time of 7.5 minutes on frequent routes. This is likely to be an acceptable wait time under many conditions.
This tracker provides an easy way to see how well the frequent bus routes are meeting their promised headways of 15 minutes or less. This can be compared to public perceptions of bus service quality to better understand what is needed to encourage greater ridership.
This tool is meant to be an informative resource, and is not intended as criticism of the MBTA.
Method
The MBTA shares real-time vehicle positions over an API that follows the General Transit Feed Specification (GTFS). This tracker streams data from the API to reduce the chance of missing stop events.
Stop events are recorded when a bus departs a stop. This is indicated by the vehicle's current stop_id changing. Any stops on non-revenue trips are omitted.
Headways are the time between consecutive stop events on the same route at a given bus stop. Long headways (>120 minutes) between scheduled service periods are omitted.
Plots
The scatter plot at the top of the page shows actual headways at the first and last stops of frequent routes. Headways at the first stop should meet the 15-minute target most frequently because there are few delays introduced by traffic or boarding & alighting. Headways at the last stop show the accumulation of all delays along the route. If headways meet the target here, they were likely met at intermediate stops.
The bar chart shows the proportion of headways on each route that meet the 15-minute target. This includes headways from all stops along the route, not just the first and last.
The histogram shows the distribution and frequency of headways on each route. It is important to consider how far off the target these headways are. Frequent 16-minute headways are much less impactful to a rider than occasional 30-minute headways. Again, this includes headways from all stops along the route.